Client: Yulife
Problem
Based on user interviews and comments from users, we saw an opportunity to boost motivation by feeding back user activity data in better ways, e.g., by making it more personal and rewarding, while supporting goal directed behaviour.
Key Questions
For this project, the main questions were: Which user data do users find motivating and how should we show it in a statistics/activity screen? Once, we identify which data to show and how to show it, can users find the right information quickly and correctly?
Approach
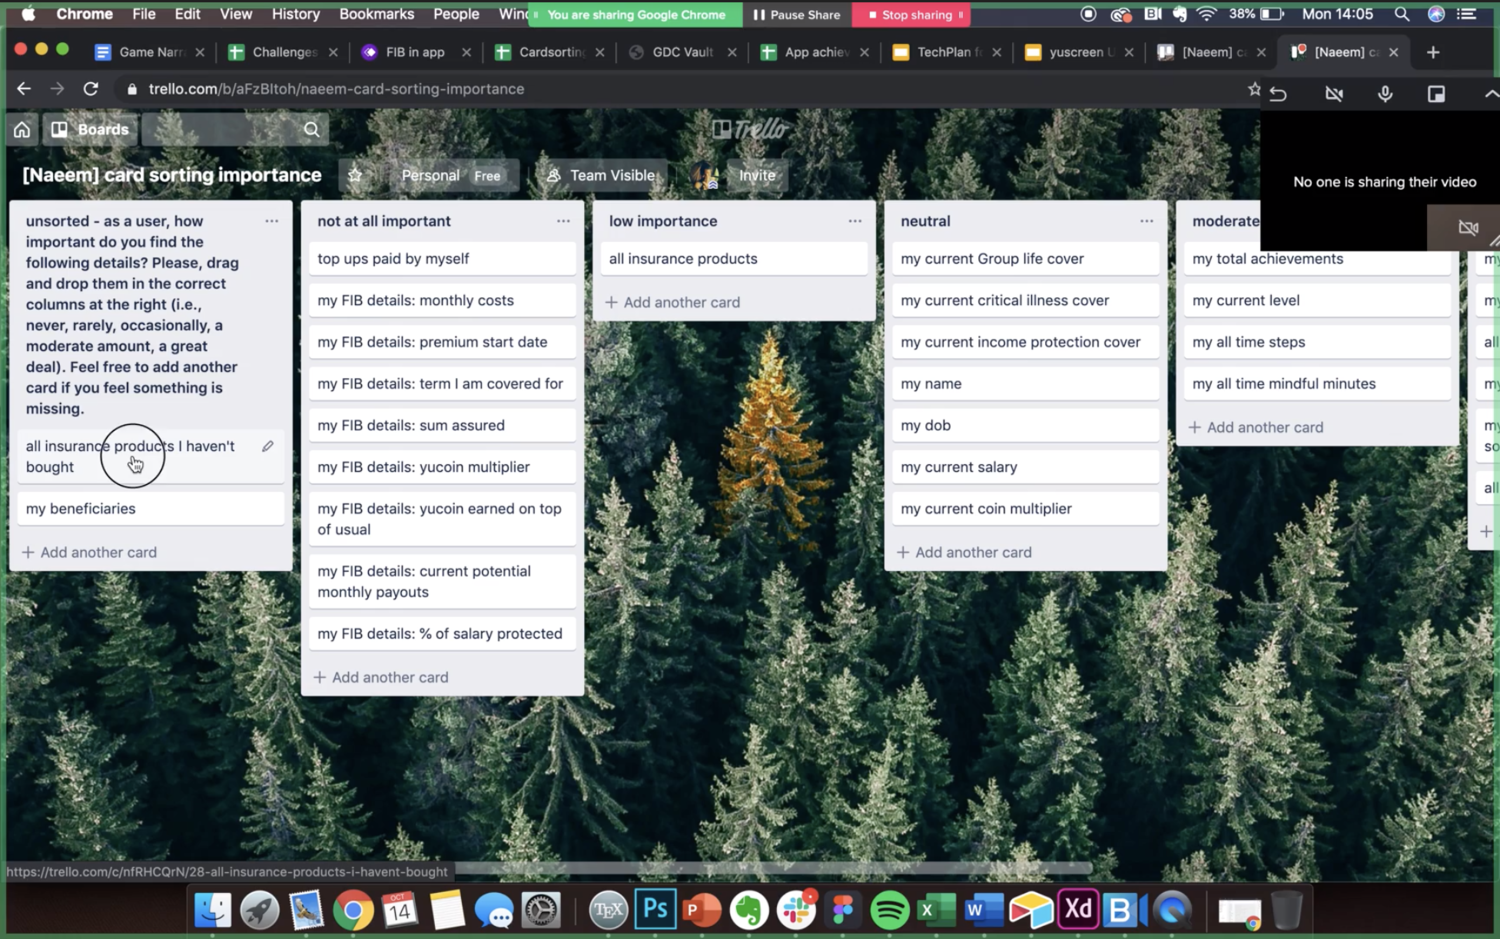
Conducted card sorting using Trello in remote sessions with stakeholders and users
2-min design/search task using UsabilityHub
Recruited participants using UsabilityHub panel
Analysed raw data with Excel
Process
Based on previous interviews, we already understood that user statistics were desirable. Using findings from the Card Sorting task wireframes were designed by UX/UI designers. In this project, collaboration with engineers from the discovery stage to shape their expectations was key.
Card Sorting
Using Trello, participants were asked to drag and drop items (i.e., user statistics, personal details, and insurance product details) into columns for different levels of importance and frequency. Card sorting was conducted with 4 internal stakeholders and 4 YuLife users and results were aggregated and analysed in Excel.
Design Test
Once designs were made by UX/UI designers based on the findings from the card sorting task, UsabilityHub was used to test the designs and to recruit participants from a panel. A simple design/search task was provided. Participants’ answers were analysed for speed, accuracy and ease of task.


Challenges
Overall, the main challenges in this project were 1) benchmarking, since there is no baseline to compare to what is acceptable, 2) missing qualitative insights as in it is unclear why participants responded the way they did, and 3) panel reliability, since we don’t know how serious participants took the task.